

 ITA
ITA  ENG
ENG SPAN
SPAN FR
FR NL
NL GER
GER FI
FI

 ENG
ENG  ITA
ITA Smart meters and IoT sensors for buildings: measuring energy, water, gas and environmental parameters
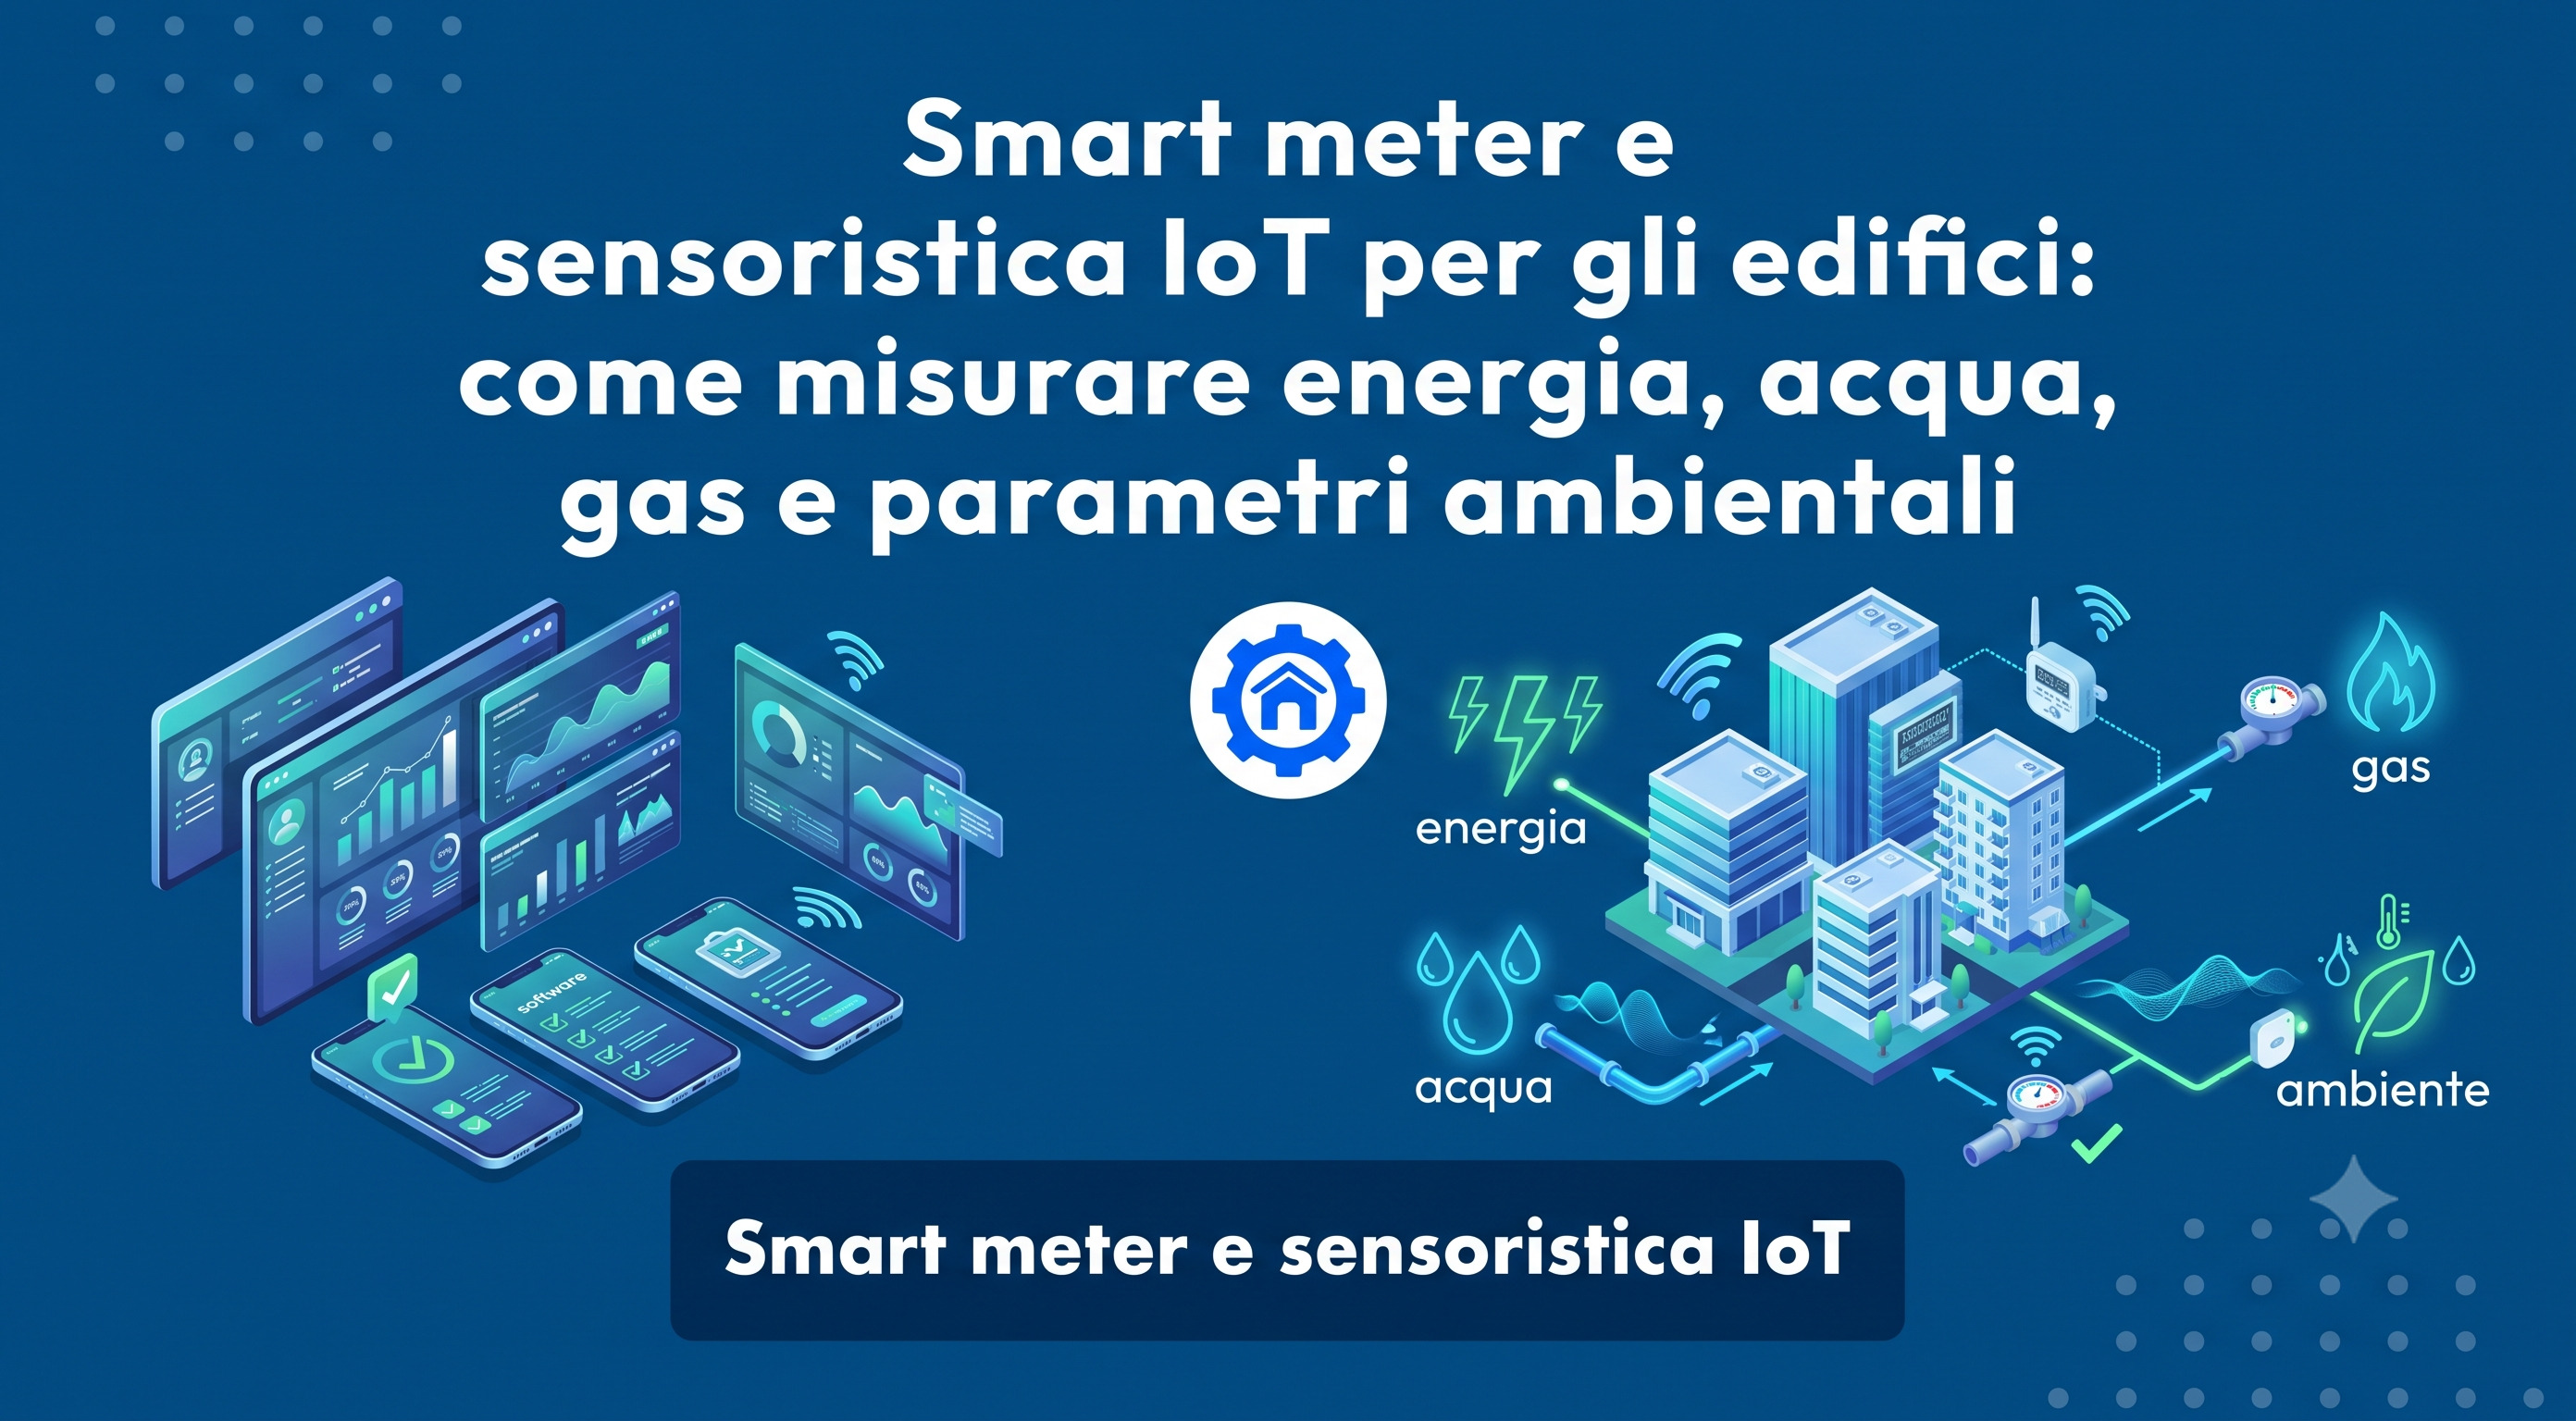
Smart meters and IoT sensors turn a building into a source of data: they measure energy, water and gas consumption as well as environmental conditions, making this information continuously available to a management platform.
The point is not to install as many as possible. It is to choose what to measure, how frequently and at which points, because the quality of the measurement plan determines which forms of waste can be identified and which energy efficiency improvements can subsequently be justified with data.
In brief:
- The distributor's meter measures the supply point, not individual systems: submetering is needed to understand where consumption occurs.
- The four flows to measure are electrical energy, thermal energy and gas, water, and environmental parameters.
- Choose transmission technology according to coverage, power supply and data frequency, not trends.
- A MID-certified meter is needed when the data becomes the basis for an invoice; for internal monitoring, accuracy matters more than metrological certification.
What smart meters are and how they differ from traditional meters
A smart meter is a meter that not only totals consumption but also records data over time and transmits it automatically. A traditional meter must be read; a smart meter shows how and when consumption occurs.
In Italy, second-generation electricity meters, known as 2G meters, have now replaced the vast majority of installed meters.
In addition to remote readings for the distributor, they make data available to end customers through Chain 2: a dedicated channel for communicating data locally to a user's device, introduced by ARERA under Legislative Decree 102/2014 and governed by CEI technical specifications.
However, an important limitation remains: the distributor's meter measures the supply point, not the building. It shows how much electricity enters through the POD, not how much is consumed by the refrigeration plant, lighting or data centre. To obtain that level of detail, downstream submeters and sensors are needed.
The four flows to measure in a building
| Flow | Typical instruments | What it helps reveal |
|---|---|---|
| Electrical energy | Panel-mounted submeters, clamp-on current transformers, power analysers | Consumption by utility and time period, active loads when the building is closed, power peaks |
| Thermal energy and gas | Heat meters, gas meters, supply and return probes | Heating plant efficiency, operating hours, overheated zones |
| Water | Ultrasonic meters, flow meters | Consumption by area, hidden leaks revealed by nighttime consumption |
| Environmental parameters | Temperature and humidity probes, CO2 sensors, occupancy detectors | Actual comfort, space occupancy, control based on data rather than fixed schedules |
Electrical energy
This is the best flow to start with because it has the greatest variability and consumption that is easiest to correct.
Submeters are installed in distribution panels. Where opening a panel is difficult, clamp-on current transformers can be fitted around cables without interrupting the power supply, with minimal downtime.
A useful level of granularity starts at 15-minute intervals: this frequency makes it possible to read load profiles and compare them across working days, weekends and closures.
Thermal energy and gas
For heating and cooling, measurement is primarily used to understand efficiency: how much energy enters the plant room and how much actually reaches the areas served. Heat meters and supply-and-return temperature probes show whether systems are operating at the right point or compensating for incorrect control settings.
Water
Water is the most overlooked flow and often the one with the quickest return on investment, because leaks remain invisible until they cause damage.
Comparing nighttime and daytime consumption is the first indicator: in a closed building, continuous water consumption at night almost always indicates a leak. Hotels have their own specific considerations, which we explore in our dedicated guide to water monitoring in hospitality facilities.
Environmental parameters
Temperature, humidity, CO2 and occupancy do not measure consumption, but they help explain it. CO2 is particularly useful as a dual indicator: it shows whether ventilation is adequate and, at the same time, how occupied a space is.
The UNI EN 16798-1 standard, published in Italian in 2025 and used as a reference for indoor air quality, classifies environments into four categories, from IEQ I to IEQ IV.
Measuring CO2 therefore supports both comfort and energy savings: ventilating a half-empty space at a fixed rate wastes energy, while insufficient ventilation in a full meeting room creates an indoor air quality problem. It is one of the foundations of a smart building.
How sensors connect: transmission technologies
There is no universally best technology. The choice depends on three things: where the measurement points are located, whether electrical power is available, and how frequently the data is needed.
| Technology | How it works | When it makes sense |
|---|---|---|
| LoRaWAN | Long range, very low power consumption, limited bandwidth, private or public network on unlicensed spectrum | Battery-powered sensors distributed across large buildings, water meters, environmental probes |
| NB-IoT | Uses cellular network coverage, suitable for small data volumes, requires an operator contract | Isolated points or sites without their own network infrastructure, multi-site portfolios |
| wM-Bus | A standard designed for meters, enabling short- and medium-range wireless data collection | Periodic readings from water, gas and heat meters |
| Zigbee and Bluetooth Low Energy | Short range, low power consumption, mesh network | Indoor environmental sensors where a gateway already exists |
| Wi-Fi | High bandwidth but high power consumption; depends on the building's network | Mains-powered devices where large volumes of data are needed |
| Modbus and BACnet (wired) | Reliable field protocols that require cabling | Connection to panels, plant rooms and existing systems, integration with a BMS or the building's building automation system |
A practical recommendation: always check that the selected system supports open protocols. A sensor network that communicates only with the platform of the supplier that sold it is a cost that is likely to recur the next time the supplier changes.
When a MID-certified meter is required
This question comes up frequently, and the answer depends on how the data will be used.
The European MID Directive (2014/32/EU), implemented in Italy through Legislative Decree 22/2007 and amendments under Legislative Decree 84/2016, concerns measuring instruments used for commercial transactions, including electricity, gas, water and heat meters.
The European MID Directive (2014/32/EU), implemented in Italy through Legislative Decree 22/2007 and amendments under Legislative Decree 84/2016, concerns measuring instruments used for commercial transactions, including electricity, gas, water and heat meters.
In practice:
- If the data becomes the basis for a bill, such as recharging consumption to a tenant, allocating costs among tenants in a property or selling energy, the meter must be MID-certified.
- If the data is used for internal monitoring, identifying waste and verifying savings, metrological certification is not required. What matters is the instrument's stated accuracy and long-term stability, because the relevant comparison is between periods measured using the same instrument.
How to design a measurement plan
Before buying hardware, decide what you want to see. A dedicated standard exists for this purpose: UNI CEI EN 17267 defines how to design and implement an energy measurement and monitoring plan, covering measurement points, quantities, collection frequency, data retention and adjustment factors.
It is also an operational way to meet the data collection requirement of ISO 50001.
ENEA's figures show that this is far from a theoretical issue: in assessments of mandatory energy audits submitted in November 2025, approximately 70% of non-conformities concerned the monitoring strategy, including unspecified measurement points, campaigns that were too short and missing load profiles.
A sensible measurement plan can be built in four steps:
- Start with the largest consumers. A limited number of utilities usually account for most of the bill: heating and refrigeration plants, lighting and large process machines.
- Define frequency before quantity. A few points read every 15 minutes are better than many points read once a month.
- Measure the context too. Outdoor temperature, occupancy and opening hours make it possible to normalise consumption and distinguish waste from justified use.
- Give measurement points consistent names. Consistent naming across buildings makes different sites in a portfolio comparable, and it must be decided at the beginning.
The logic is the same as for an energy audit, with one difference: an audit is periodic, whereas monitoring is continuous.
The mistakes we see most often
In the projects we work on, problems rarely concern the technology itself. They concern how it is deployed:
- Sensors are installed but never connected to a process. If nobody reviews the data and nobody is responsible for acting on it, monitoring becomes a cost.
- Too much granularity too soon. Starting with hundreds of points creates unreadable dashboards. Begin with the main utilities and add detail where the data reveals something useful.
- Sensors are in the wrong position. A temperature probe above a radiator or near a glass window measures the microclimate in that corner, not the room, and can cause the entire system to be controlled incorrectly.
- The sensor network is not maintained. Flat batteries and offline devices create gaps in the data, and gaps in historical records undermine the baseline used to demonstrate savings. The sensor network must be managed like any other installation, following the same principles as predictive maintenance.
- Measuring without comparing. Consumption only becomes meaningful in relation to something: the previous period, a similar building or an expected value.
From data to action
Measurement is the starting point, not the result. Value is created when data becomes alerts, automation and actions assigned to specific people.
UTwin's energy management software covers the entire process: supplying smart meters and IoT sensors for energy, water, gas, temperature, humidity and CO2; collecting data on a cloud platform; and displaying it on the building's BIM model or floor plan.
AI algorithms analyse the data to identify anomalies and remotely adjust systems according to outdoor conditions and space occupancy.
Maintenance management software (CMMS) is natively integrated: an anomaly detected by sensors becomes a tracked maintenance task rather than an alert left on a dashboard.
Where a BMS already exists, the platform integrates with it and enhances its remote automation. Where a traditional BMS does not provide a sufficient return on investment, such as in retail stores, supermarkets, hotels, care homes and small offices, it operates as a light BMS with CAPEX up to 70% lower.
For more information about the platform's data collection and analysis, see our guide to building energy consumption monitoring, our overview of energy management software on the market, and our explanation of what an EMS is.
Frequently asked questions
- What is the difference between a smart meter and a submeter?
A smart meter records and transmits data automatically. A submeter is installed downstream of the main meter to measure an individual utility or area of a building. A submeter can be a smart meter, and in practical energy monitoring it almost always is.
- Is data from a second-generation meter sufficient to monitor a building?
They provide an overall picture of the supply point, but they do not show where consumption occurs. Submetering with downstream meters and sensors is needed to attribute consumption to systems and areas and therefore identify waste.
- Do monitoring sensors need MID certification?
Only when the data is used to bill or recharge consumption to third parties. It is not required for internal monitoring or savings verification; measurement accuracy and instrument stability are what matter.
- How many sensors does a building need?
There is no fixed number. It depends on how many significant utilities there are and which decisions need to be made. An effective approach is to start with the utilities that account for the largest share of the bill and the areas with known comfort issues, then expand coverage where the data reveals anomalies.
- Which is better: LoRaWAN or NB-IoT?
LoRaWAN is useful when installing many battery-powered sensors across a building or campus and creating a private network. NB-IoT is useful for isolated points or sites where you do not want to manage network infrastructure, relying instead on cellular coverage. Both technologies often coexist across real estate portfolios.
Where to start
The quickest way to determine whether measurement is worthwhile is to start with a pilot building: submeter the main utilities, install environmental sensors in critical areas and collect readings every 15 minutes for a few weeks.
The initial load profiles will already indicate whether the problem lies in management, the systems or the building envelope, and provide an indication of the appropriate scale of intervention.


Informative Material