

 ITA
ITA  ENG
ENG SPAN
SPAN FR
FR NL
NL GER
GER FI
FI

 ENG
ENG  ITA
ITA Energy management in data centers: PUE, monitoring and reporting obligations
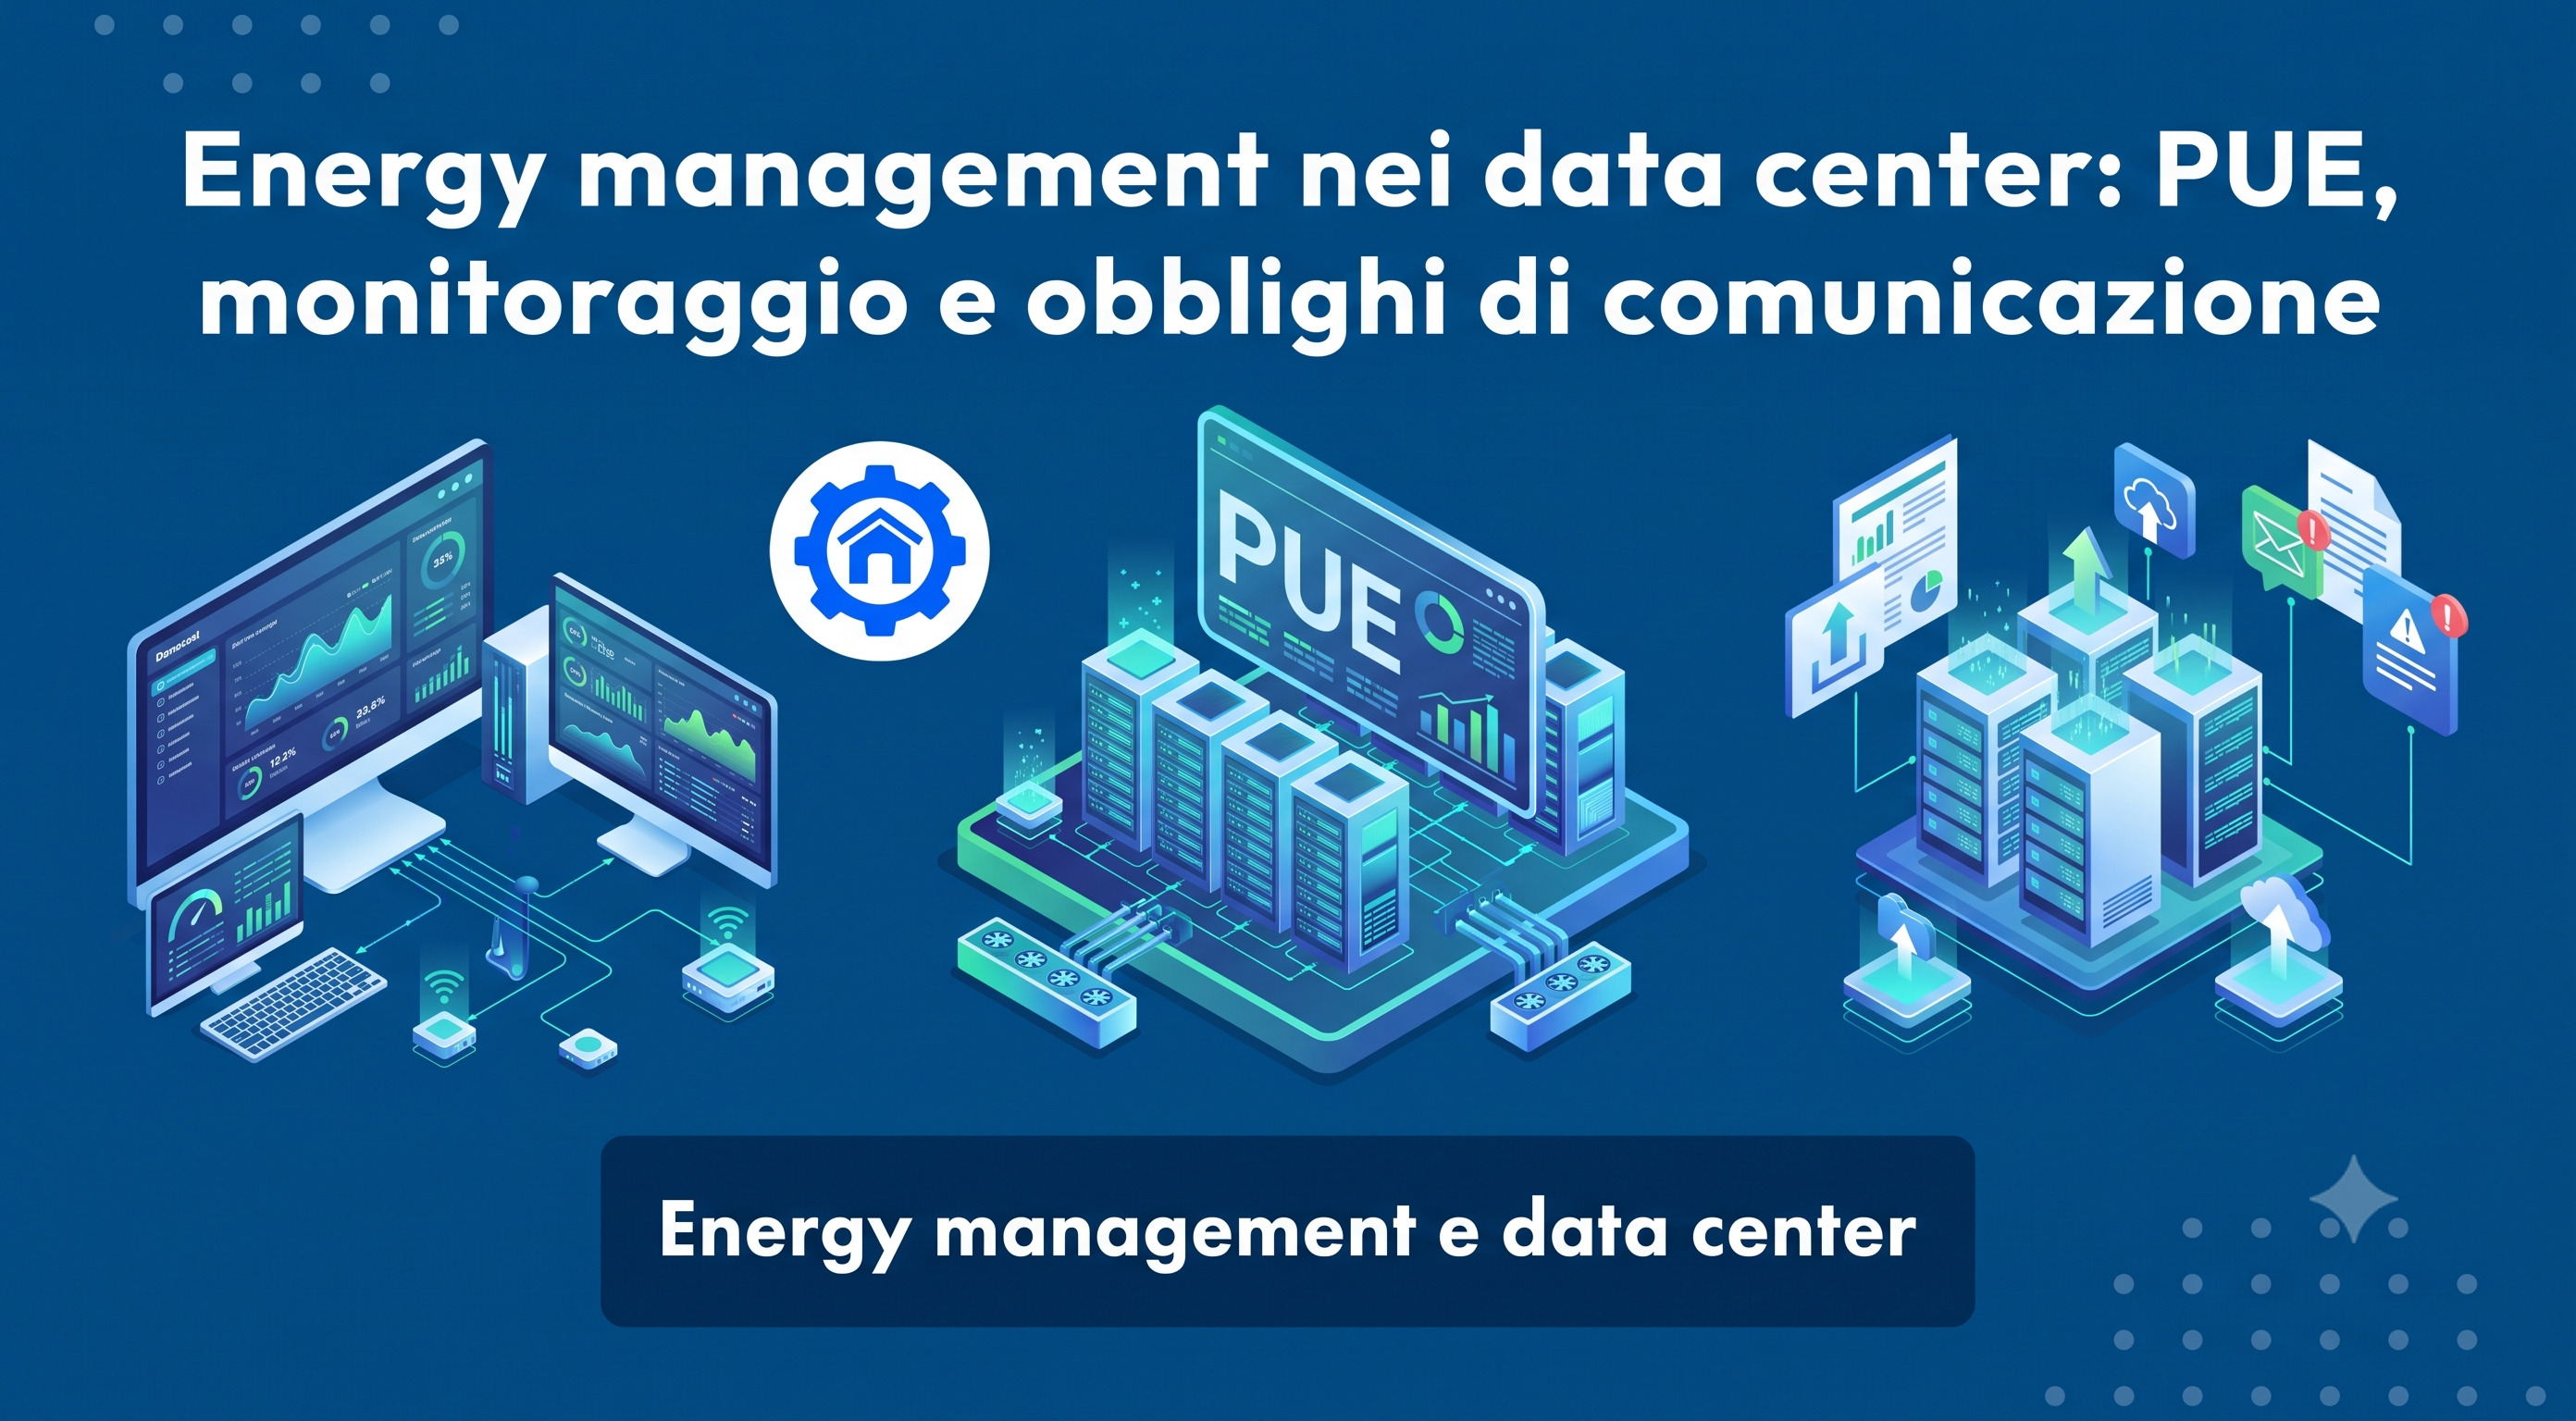
In a data center, energy is not just another cost item: it is the main operating cost and also the physical limit to growth. This is why the sector has always measured its efficiency using an indicator that has become a de facto standard: PUE.
Since 2024, measurement has been accompanied by an obligation: the European Energy Efficiency Directive requires data centers above a certain size to report their performance every year.
In brief:
- PUE compares the site's total energy consumption with the energy used by IT equipment.
- Cooling is the largest non-IT energy use and the main area for improvement.
- Data centers with installed IT power of 500 kW or more are subject to European reporting obligations.
- Server rooms inside commercial buildings are the most overlooked case: small, redundant and never monitored.
PUE and its limitations
PUE (Power Usage Effectiveness) is the ratio between the total energy consumed by the data center and the energy consumed by IT equipment alone. A PUE of 1 would mean that all energy goes to the servers; actual values are higher because cooling, uninterruptible power supplies and distribution also consume energy.
It is a useful indicator, but there are two limitations to be aware of. First, it also improves as the IT load increases, so a fuller site appears more efficient with the same systems. Second, it says nothing about the efficiency of the work performed: two rooms with the same PUE can deliver very different services.
For this reason, other indicators are used alongside PUE, from water use for cooling to the heat actually recovered and reused.
European reporting obligations
Under the Energy Efficiency Directive EED 2023/1791 and Delegated Regulation (EU) 2024/1364, data centers with installed IT power of 500 kW or more must annually report a range of information about their performance: energy consumption, usage indicators, operating temperatures, data traffic processed, the share of renewable energy and recovered waste heat.
The data is collected in a European database that can be consulted in aggregated form. For installations above one megawatt, the directive also encourages participation in the European Code of Conduct on Data Centre Energy Efficiency and the adoption of heat recovery solutions.
The practical consequence is that measurement is no longer a management choice: it is a compliance requirement, and it calls for reliable, continuous data rather than annual estimates.
Where action really makes a difference
Leaving aside the IT load, which depends on the services delivered, there are three main areas for improvement.
Cooling. This is the dominant non-IT energy use. Established approaches include containing hot and cold aisles to prevent treated air from recirculating, using free cooling when outdoor conditions allow, and carefully raising supply-air temperatures within the limits recommended for the equipment.
Electrical distribution. Uninterruptible power supplies and transformers often operate at partial load for redundancy reasons, which is when their efficiency is lowest. Measuring losses along the chain is the way to understand the cost of the chosen redundancy level.
Heat recovery. The energy leaving servers is low-temperature heat: where there is a nearby user, such as offices or district heating networks, it becomes a resource rather than a disposal cost.
Server rooms in commercial buildings
There is also a case that affects most companies: not the data center itself, but the internal server room, with a few tens of kW inside an office building, hospital or corporate headquarters.
These spaces are often overlooked by definition: cooled 24 hours a day by dedicated units, frequently oversized, rarely monitored and almost never included in building efficiency projects. In practice, they have three recurring problems:
- Overcooling. Supply temperatures are set much lower than necessary, often years ago, and never reviewed.
- Air recirculation. Racks are arranged without a clear aisle layout, allowing hot air to return to the air intakes.
- Invisible consumption. The room has no dedicated meter, so its consumption is included in the building's total and no one knows how much it accounts for.
The first step here is not an HVAC intervention: it is to install a meter and two temperature probes.
What to measure
| What | Why | Useful indicator |
|---|---|---|
| Total site energy and IT energy | It is the basis for calculating PUE | PUE, calculated annually rather than as a spot measurement |
| Cooling consumption | It is the area for improvement | Share of cooling in total non-IT consumption |
| Supply and return temperatures | They reveal air recirculation and overcooling | Temperature difference between the cold and hot aisles |
| Load on uninterruptible power supplies | Efficiency decreases at partial load | Load percentage relative to rated capacity |
| Water, where used for cooling | Efficiency decreases at partial load | Water consumption relative to IT energy |
The tools
Specialized DCIM platforms exist for large data centers, designed to manage racks, capacity and IT infrastructure. That is not UTwin's area of focus, and it is right to make that clear. The general method, from the measurement plan to verification, is described in the energy management guide.
UTwin's energy management software works at the building level: it monitors energy, water and environmental parameters using smart meters and IoT sensors, places data on floor plans, raises alerts for anomalies and allows systems to be controlled remotely.
It is suitable for server rooms inside commercial buildings and for anyone who needs to manage the room's consumption alongside that of the rest of the property.
The integrated maintenance software (CMMS) covers the aspect that matters most in these environments: continuity. An anomaly detected by sensors becomes an assigned maintenance task before it causes downtime, following the approach described in the predictive maintenance guide.
Frequently asked questions
- What is PUE and what should its value be?
It is the ratio between the data center's total energy consumption and the energy used by IT equipment. The closer it is to 1, the less energy is spent on supporting services such as cooling and distribution. The reference value depends on the size, climate and cooling technology, so improvement over time matters more than absolute comparisons.
- Which data centers must report their energy consumption?
Those with installed IT power of 500 kW or more, under Directive EED 2023/1791 and Delegated Regulation (EU) 2024/1364. The reported information is collected in a European database.
- Is PUE enough to determine whether a data center is efficient?
No. It can improve simply by increasing the IT load and does not account for the service delivered. It should be read alongside other indicators, such as water use and recovered heat, and tracked over time at the same site.
- Should a small corporate server room also be monitored?
Yes, and this is where the cost-benefit ratio is best: a dedicated meter and a few temperature probes are enough to identify overcooling and air recirculation, two very common problems that can be corrected without major investment.
Where to start
If the room does not have its own meter, PUE is only an estimate and any discussion about efficiency stops there. The first step is to separate the measurement of the IT load from that of supporting services: from that point on, every intervention can be verified.


Informative Material